
Considering Simpson’s Paradox in Mobile Advertising

Benjamin Disraeli (British Prime Minister 1874–1880) is said to have coined the phrase “There are three kinds of lies: lies, damned lies, and statistics.” Improper use and understanding of statistics can lead to poor marketing decisions.
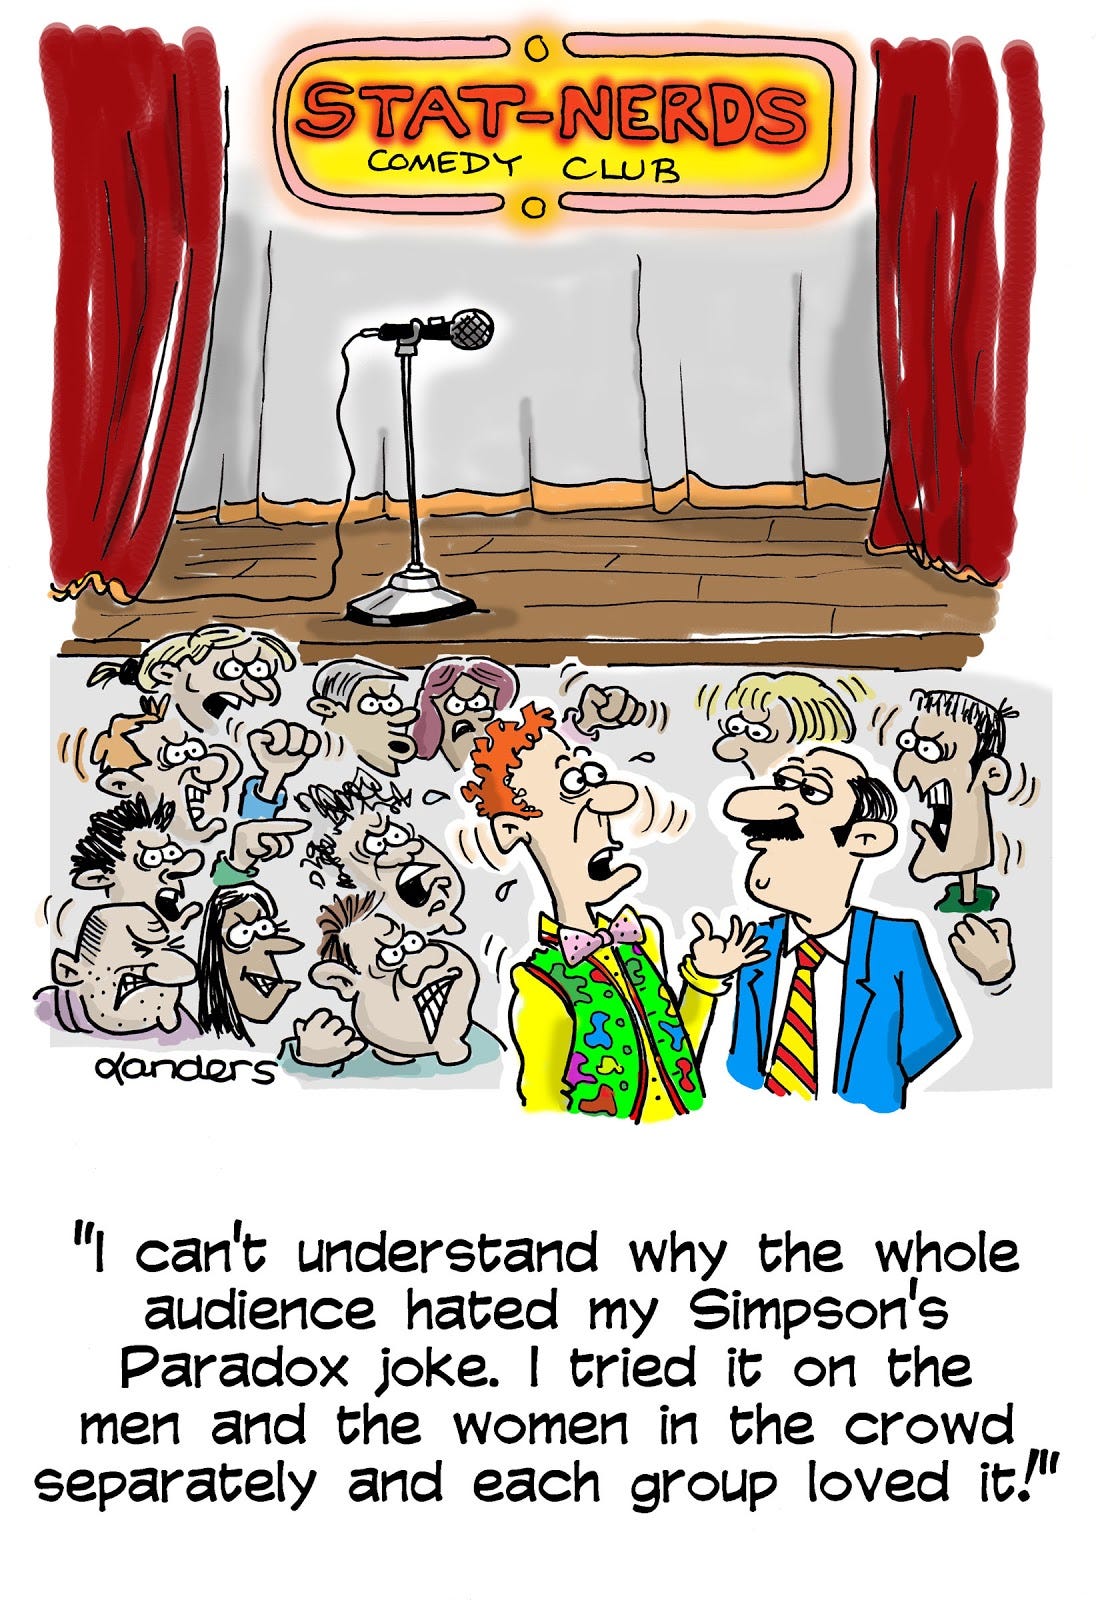
An example of this is Simpson’s Paradox, a phenomenon in which a trend appears in several different groups of data but disappears or reverses when these groups are combined.
One of the most famous examples of this is from a study of gender bias at UC Berkeley. In the 1970s, there was a period when the admissions data for the UC Berkeley graduate school exhibited some peculiar statistical correlations. Specifically, admission figures for 1973 showed a strong negative correlation between being female and being admitted: 35% of female applicants admitted, vs 44% of male applicants. This negative correlation was nearly the basis of a lawsuit alleging gender bias in the admissions process.
However, further investigation of data revealed that none of the individual departments’ admissions data exhibited this negative correlation between being female and being admitted. In fact, most departments reported a positive correlation between being female and being accepted. In other words, a correlation that appeared at the level of the aggregated data was reversed at the departmental level.
Below is an example of how the Simpson’s Paradox fallacy can cause marketers to misinterpret the results of their campaigns. In this simplified example from mobile advertising, the dataset is from an install campaign measuring the install rate performance, with data broken out by platform (iOS or Android).
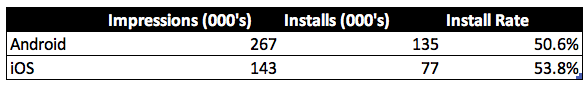
Clearly iOS outperformed Android in this campaign, so the marketing director should allocate more budget to iOS devices for this campaign, right?
A deeper dive into the data, broken out by sub-platform (tablet or phone), shows a different story.
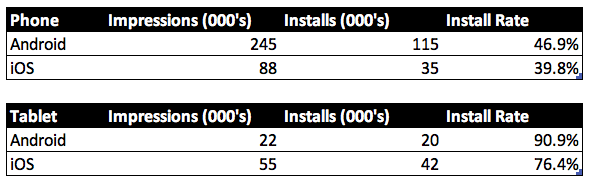
Android installs outperformed iOS on both sub-platforms, and yet the aggregated data shows iOS outperformed Android. How can both results be true?
In understanding Simpson’s Paradox, we must also understand the concept of a confounding (or lurking) variable. In this instance, the sub-platform (phone or tablet) introduces a bias: 38% of the iOS impressions occurred on tablets, whereas only 8% of Android impressions were on tablets.
In this instance, the marketing director should consider whether the splits between tablet and phone impressions accurately represent the target populations.
This is of course an overly simplified example, but it does originate from real-world experiences. When designing campaigns, marketers should try to consider the granularity of audiences, and the campaign setup should aim to surface confounding variables without being disproportionately complex relative to the overall budget.
If you would like to learn more about Simpson’s Paradox, the “Mathematical Games” column of the March 1979 issue of Scientific American (page 119 in the PDF) is a great read. As an added plus, there are some great period advertisements in the magazine. When is the last time you saw Lancia cars being advertised in the US, or a nice “What we’re doing for your health” PSA from Union Carbide?
More…

Game Makers Are Doubling Down on Hybrid Monetization – Here’s Why
Key takeaways from our recent Gamesforum "Mobilize and Monetize" podcast discussing how in-game is driving monetization evolution.The Shift Towards Hybrid Monetization According to AdInMo and Gamesforum's report, 72% of game developers were planning to advance a...

A/B Testing Your InGamePlay Placements
Testing InGamePlay ad placements to understand the full potential and optimize implementation is always recommended. You can enable sandbox mode for device testing and set-up A/B tests to understand impact on your key metrics. Here’s a useful case study from our...

Beyond Banner Ads Part 4: Promoting IAPs to optimize for higher ROI
The final instalment from advisor Tiffany Keller in our series deep-dive series looks at how to harness player intentionality to serve the right message with higher ROI than an impression, with analysis on Spades Fever. When you’ve solved for the Substitution Effect...